|
|
| The Last Word on Processes |
By: HealthBond - Luttman
|
|
Before moving on to other topics I would like to talk about a few more process thinking tools. My purpose is to get you thinking about improving processes as you design and implement your pathways, or any other process. Designing a process is the perfect time to improve the process.
The Critical Path
At one time I spent a lot of time helping people develop and implement pathways. Two issues seemed to bog teams down more than others:
Sequencing activities
Getting all the work done in the target length-of-stay (LOS)
One tool for analyzing these problems, and hopefully resolving them, is the Activity Network Diagram (AND). The tool is derived from an old project management tool call the PERT chart. The AND gives teams a tool for thinking through and discussing the sequence of activities and the LOS together.
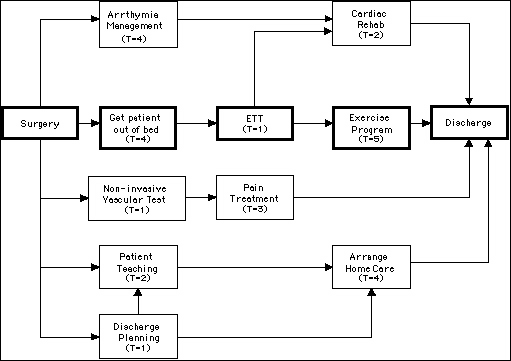
A (very) simple post-op process is shown below as an activity network diagram.
Using the Tool
The diagram flows from left to right.
The arrows indicate the relationship between activities. Activities at the pointy end cannot begin until the activity at the other end is complete.
"T" equals the number of days to complete the entire process.
The bolded activities are the rate limiting steps in the process, you cannot discharge a patient any faster than you can complete these activities. These activities, collectively, are called the critical path. And, yes that is where the term critical pathways came from.
Adding the times for each activity on the critical path tells you the expected LOS.
The diagram tells you three important things about your pathway:
The expected LOS
The rate limiting steps in the process
The relationship between activities
With this information, and the handy diagram as a tool, you can play what-if games ad infinitum. Test various scenarios and assumptions.
Using this tool can mitigate many of those discussions that drag a pathway authoring process out. It provides a structured and quantitative tool for addressing process design.
Some of you will notice that the tool assumes that a lot of things are constant, like the activity times and the relationships. The tool is expandable using a slightly different equation that takes into account variation in times. Project management software easily accounts for variation.
Variation in the relationships - such as only some patients requiring pain treatment - is a little more complicated, using multiple diagrams and comparing the results is the simplest solution. Again,computer programs can easily handle the situation.
Creating and Managing Diagrams
While the Japanese have successively adapted this tool for manual use, using 3x5 cards and big tables, that is not my idea of fun. I'd rather use a project management program on my trusty laptop. The analyses are faster, I have more tools and graphs to help the analysis, and I can connect the analysis to a spreadsheet and do the financial modeling we discussed last time. And I'm still using the same version of MS-Project I bought in the early 90's. (Please don't tell Mr. Gates that). The point is that this is not exactly rocket science that requires some $2000 program.
And This Relates to Quality, How?
This tool is a powerful tool for designing and understanding clinical processes. This tool can help you understand why your LOS distribution looks like this:

Add best case and worst case estimates (or even more refined data) to the activity times in you diagram and rerun the numbers. You soon will begin to understand how and why patients spread out along the X-axis and cluster around certain points.
What activities are driving the LOS?
What is about those activities could we change to improve the process?
What relationships could we change, do we really have to do Activity A before Activity B?
Can we do them in parallel?
Can we eliminate some activities, at least for certain subpopulations?
This is a much more focused analysis of the process. It is also activity focused, you are connecting process to outcomes. This connection is a major thread in this series of articles. Organizations that achieve performance excellence make that connection, they know why the are getting the outcomes that
they get, and what they can do about the situation. If you are applying for a quality award based on the Baldrige award you must make the connection.
Fishin' for Quality
Now that you have a process designed you can sit back and relax, because your job is done. Right? We got the pathway, let's get going.
Wrong
Very Wrong.
Now is the time to really start looking at the process, while it's still in design mode. Now is the time to pull out that cause-effect diagram you learned about. You probably remember it as the fishbone diagram.

Just the quick review of the tool for those familiar with it. The "error", "defect", "variance", or "problem condition" is stated in the box on the right. The causes of that condition are listed, by category, on the branches to the left. More detail adds more levels of branches. (For those of you who would like a more detailed description visit my web site).
The major use of the fishbone in the design stage is to troubleshoot the process before implementation and deal with problems now. I think you deliver better quality when you don't use your patients as beta testers, that works only on the Internet. And rarely there.
You can, of course, extend this analysis and make it more systematic. One easy way is to incorporate the fishbones into the activity network diagram. Attach a fishbone to each important activity on the diagram. This shows people not only what the process is, but its potential problem spots as well.
Looks Like a Whole Lotta Work
Before you all start thinking I design forms and procedures for theIRS, or I am just some kinda paperwork freak, let me deal with the workload issue. (Anyone who has ever seen my office knows I am not a paperwork freak.)
The number one rule of quality is: Focus on the Important Few Activities or Outcomes that Impact Patient Care. That is what the activity network is designed to help you accomplish. What is really important here?
Second, these are analytical tools that provide a context for analyzing and discussing process design issues. To the extent they provide that assistance fine. You are not being graded on the paperwork, just the care.
Third, these are tools that also work informally (as the Japanese have shown) or on the back of an envelope (where I have done a few). Or at least a whiteboard (where I have done many). Some organizations (government, defense contractors, etc.) go to great lengths with these tools, and can't brew coffee. Others do this intuitively or informally accomplish great things. Use these tools in a way that is comfortable and appropriate for you and your organization.
Fourth, be realistic. There are some bodily processes you do not want to be fishboning.
___________________________________________________________
Bob Luttman is a member and contributor of HealthBond. View his expert page on HealthBond.
Bob Luttman is Principal Consultant with Robert Luttman & Associates, a healthcare management consulting practice specializing in clinical pathways, quality and performance measurement, process improvement, and total quality management.
As a leading healthcare and quality management consultant Bob has written and presented extensively on a variety of topics including Statistical Process Control (SPC) in healthcare and organizational performance assessment. He is actively involved in regional and national organizations, currently serving as the Healthcare Chair of the Boston Section of the American Society for Quality Control. In the past he has served as President and Board Member of the New England Healthcare and Information Systems Society. Bob is also a Certified Examiner for the Massachusetts Quality Award, based on the Malcolm Baldrige National Quality Award.
January 10, 2000
|
|
Printer-friendly format
|
|
|
|

